Quarterly report on electromobility in Bavaria Q1/2026
On average every one and a half weeks at the public charging station
23.04.2026
The proportion of new registrations of electrically powered cars has risen sharply again in recent quarters. More and more users are fully dependent on publicly accessible charging infrastructure. An average of nine public charging processes were carried out by each BEV in Bavaria in the last quarter.
The figures in detail (***see assumptions)
Charging infrastructure
1) Charging locations:
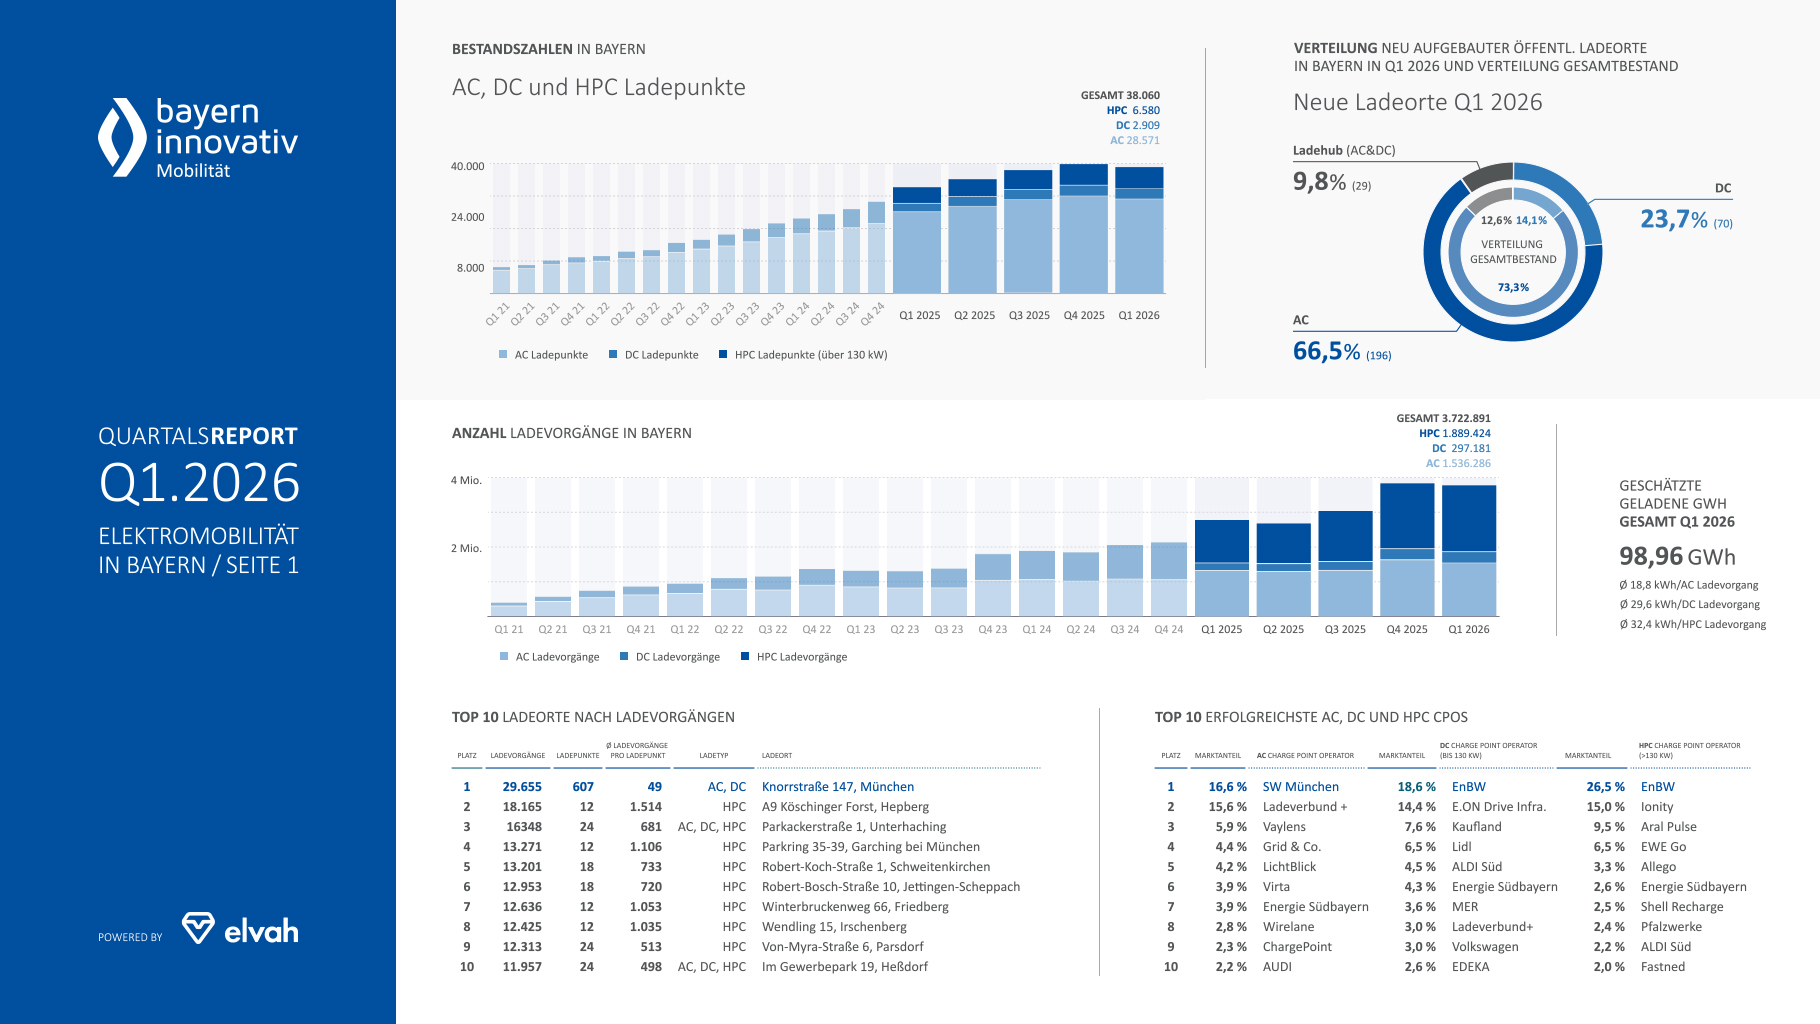
In Q1, modernizations or new installations were carried out at a total of 295 charging locations in Bavaria. In total, there are now over 38,000 publicly accessible charging points available to electric mobility enthusiasts, whose current occupancy status and much more information can be viewed via the Bavarian Charging Atlas. Attentive observers will notice that the absolute number of charging points has fallen compared to the previous quarter. This can probably be explained by the fact that since April 14, 2026, operators of publicly accessible charging points (CPOs) have been obliged to transmit their static and dynamic data in DATEX II format via an interface (API) to the national access point - in Germany the Mobilithek. In many cases, this requirement has probably also led to a review and subsequent cleansing of charging infrastructure data. We therefore strongly assume a non-representative one-off effect. A third of these new charging locations are AC locations with Type 2 plugs, and just under a quarter are purely DC fast charging locations. Accordingly, the proportion of new or renewed charging hubs (mixed charging locations with AC & DC charging points) was around 10 percent in the last quarter. The total charging infrastructure in Bavaria is currently made up of 73% AC-only charging locations and roughly two equal proportions of mixed and DC locations (13% and 14%).
2) Charging processes:
The 3.7 million charging processes processed (at publicly accessible charging points) in the past quarter are only just below the record set in the previous quarter. The decline of just under 0.1 million charging sessions took place in the area of AC charging (1.5 million), while fast charging sessions set a new record of 2.2 million. As a result, the gap between AC and DC/HPC charging processes is continuously widening. As a result, the ratio of AC to DC charging processes is now only 0.7 to 1. In the past quarter, an average of 97 charging processes were carried out per charging point and an average of around 26.6 kWh (forecast) was charged per charging process. It should be noted here that only 18.8 kWh are charged during an average AC charging process, while 29.6 kWh (DC) and 32.4 kWh (HPC) are charged during an average fast charging process. In total, the amount of energy charged in Bavaria in Q1 2026 is forecast to be around 99 GWh, which also represents a new record.
3) TOP 10 charging locations in Bavaria
The BMW site in Munich is one of the largest (semi-)public charging hubs in Bavaria, with over 600 charging points and a wide range of charging capacities for its users. Due to the high number of charging points, a correspondingly high number of charging processes are handled there, meaning that this location was once again able to secure first place. In terms of the average number of charging processes per charging point, however, this location, with 49 charging processes per quarter, is well below the Bavarian average, which, as mentioned, was 97 in Q1 2026.
The situation is completely different at locations 2, 4, 5, 6, 7 and 9. At these Ionity fast-charging parks located directly on freeways 8, 9 and 94, well over 1,000 charging processes per charging point were again processed in the last quarter. This means that these charging points are used more than ten times as often as the Bavarian "average charging point". The 1,514 charging processes per charging point at the Köschinger Forst service area in Hepberg even correspond to an average of almost 17 charging processes per charging point per day.
The remaining three TOP 10 charging locations in Bavaria are also all fast-charging parks close to freeways, although in these cases they are operated by EnBW and Energie Südbayern.
4) TOP 10 CPOs in Bavaria
In terms of CPOs (charge point operators), a differentiated picture emerges for AC, DC and HPC operators in Bavaria.
Almost a third of Bavaria's publicly accessible AC charging points are operated by Ladeverbund+ and Stadtwerke München. Vaylens, Grid & Co. and LichtBlick follow at a considerable distance behind. The TOP 10 AC CPOs operated almost 62% of the Bavarian AC charging infrastructure in Q1 2026.
The picture is somewhat different for the operators of Bavarian DC charging infrastructure with a nominal charging capacity of up to 130kW. On the one hand, four food retailers - Kaufland, Lidl, Aldi Süd and Edeka - are represented among the TOP10 CPOs. Secondly, two CPOs also clearly dominate the market in the DC sector. EnBW (18.6%) and E.On Drive Infrastructure (14.4%) recently had a combined market share of exactly 33%. Here too, Kaufland follows at a considerable distance in third place with a market share of just under 8%. It is followed at a slight distance by its sector competitors Lidl and Aldi Süd. At over 68%, the TOP 10 DC CPOs operated more than two thirds of the Bavarian DC charging infrastructure in Q1 2026 and therefore had a higher total market share than the AC TOP 10 CPOs.
The highest concentration of providers can be observed among HPC operators of charging points with a nominal charging capacity of more than 130kW. The TOP 3 operators of EnBW (26.5%), Ionity (15%) and Aral Pulse (9.5%) have a market share of more than 50% in this segment, while the market share of the TOP 10 is over 72%.

Electric vehicles:
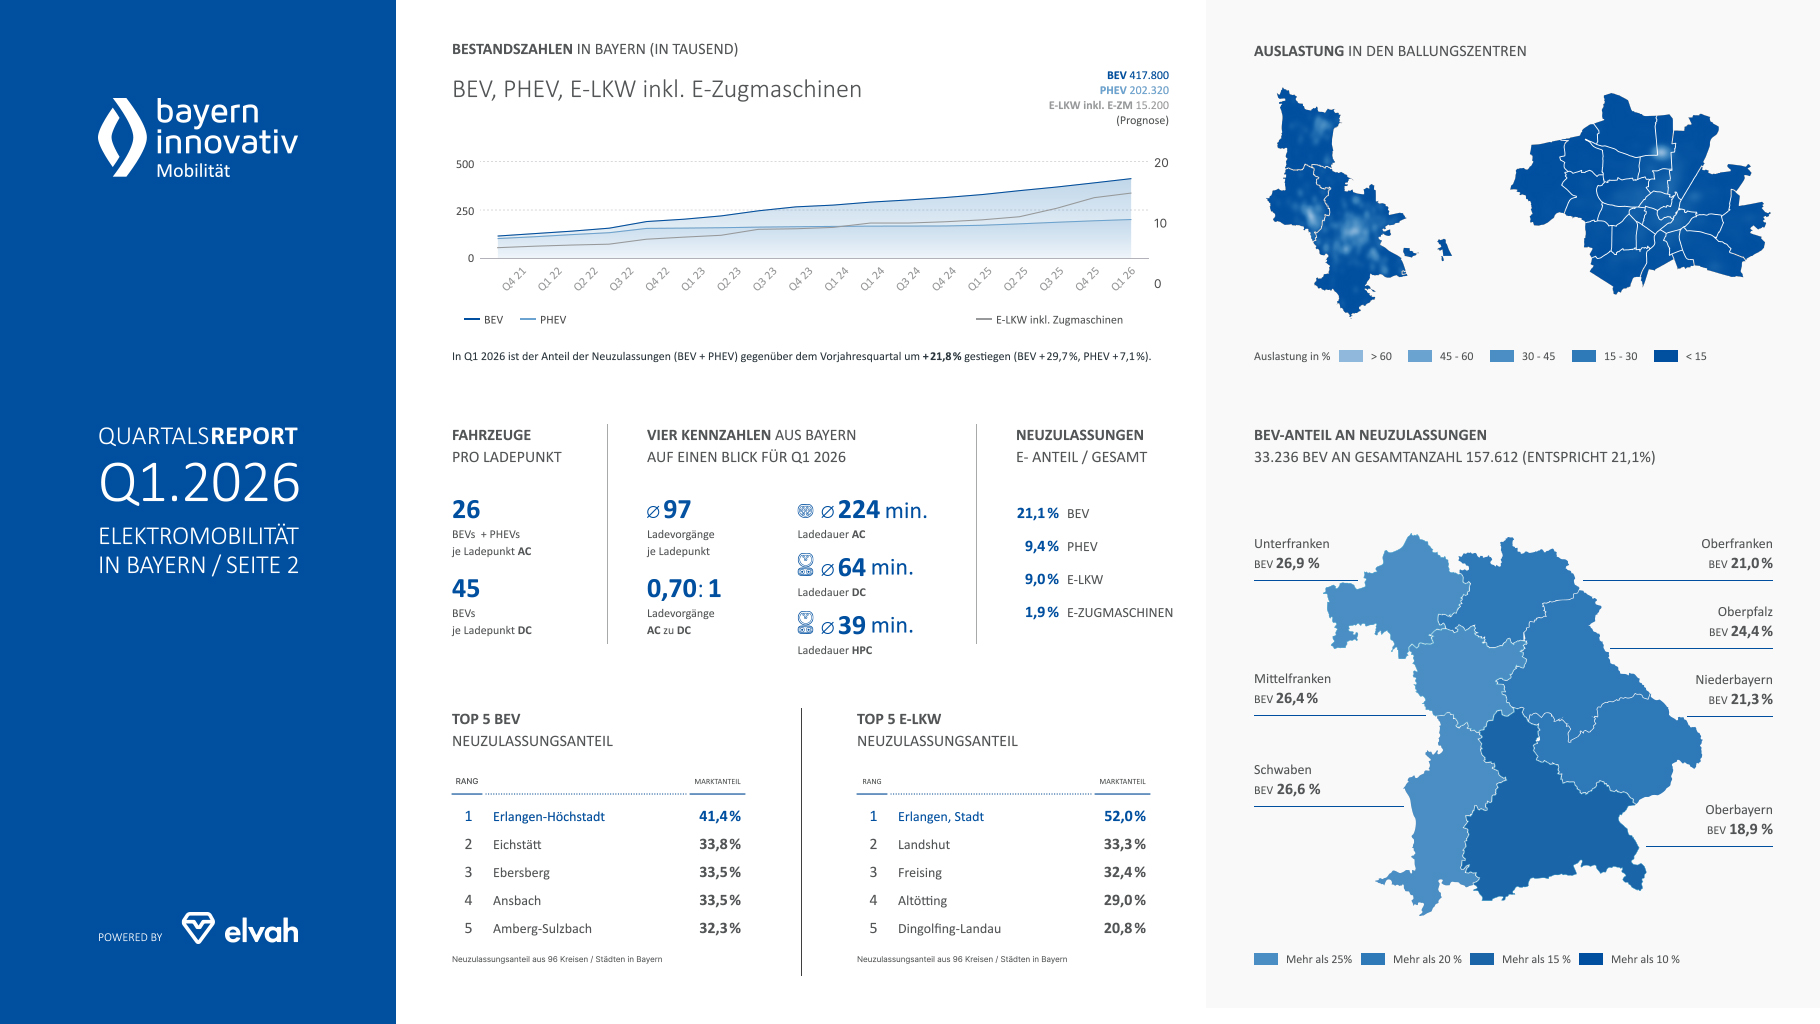
The share of new registrations (BEV + PHEV) of electric vehicles in Bavaria in Q1/2026 was 30.5%, 3.1 percentage points below the previous quarter. This is mainly due to the below-average share of new BEV registrations in the administrative district of Upper Bavaria (see chart on the bottom right of page 2). Nevertheless, it can be noted that the proportion of newly registered BEVs + PHEVs has risen significantly in the last two years. There are currently over 600,000 chargeable cars on the road in Bavaria. The number of chargeable vehicles (BEV + PHEV) per public AC charging point has recently risen to 26 vehicles in Bavaria. This is presumably due to the aforementioned adjustment effects, which resulted in a reduction of around 1,500 AC charging points in this quarter. In Bavaria, one DC charging point is once again shared by the equivalent of 45 BEVs. This means that the efforts to expand the DC charging infrastructure in Bavaria are having an impact and are currently keeping pace with new e-vehicle registrations.
The proportion of new registrations of BEVs in Bavaria in Q1 was 21.1% and of PHEVs 9.4%. The largest share of pure electric vehicles (BEVs) in new registrations was again registered in the administrative district of Lower Franconia (26.9%). This was closely followed by the administrative districts of Swabia (26.6%) and Middle Franconia (26.4%). As mentioned above, the administrative district of Upper Bavaria achieved the lowest share of new BEV registrations in Bavaria in the past quarter with just 18.9%.
The share of new registrations of electric trucks in Q1 2026 was 9%. The share of newly registered electric tractor units with over 7.5t tzGm increased by almost half compared to the previous quarter to 1.9%. In the commercial vehicle sector, there are already over 15,000 all-electric e-trucks and e-trucks on the roads in Bavaria.
The forecast values for the vehicle stock figures (BEV, PHEV and e-trucks) and the calculation methodology were adjusted at the beginning of 2026 after comparing the stock figures published by the KBA.
TOP 5 districts / cities BEV new registration share:
Broken down to cities or districts, the district of Erlangen-Höchstadt (Middle Franconia) lands in first place in Q1 2026 with a BEV new registration rate of 41.4 percent. The district of Eichstätt (Upper Bavaria) follows in second place with almost 34%. The districts of Ebersberg (Upper Bavaria), Ansbach (Middle Franconia) and Amberg-Sulzbach (Upper Palatinate) follow close behind in 3rd, 4th and 5th place with almost the same proportion of new registrations.
TOP 5 districts / cities e-truck e-truck share of new registrations:
In terms of e-trucks, the city of Erlangen (Middle Franconia) comes in first with a very high e-truck new registration share of 52 percent, with a correspondingly large gap. The district of Landshut (Lower Bavaria) comes in second with a good 33 percent e-truck new registration share. With just one percent less, third place goes to the district of Freising (Upper Bavaria). The districts of Altötting (Upper Bavaria) and Dingolfing-Landau (Lower Bavaria) complete the TOP 5 with 29 and 21 percent of new e-truck registrations respectively.
Government districts in detail:
For the first time in the Q1 2026 quarterly report, we are publishing numerous additional charging infrastructure figures on page 3 to provide an even more detailed insight into the seven Bavarian administrative districts. On the one hand, we show the average charging processes (CP) per charging point (CP) and per BEV, from which forecasts on the use of the public charging infrastructure in the administrative districts can be derived. The key figures BEV per public charging point and cars per public charging point can be used to analyze the extent to which the market penetration of BEVs has already progressed.
Reference figures from Bavaria
As mentioned above, an average of 97 charging processes per charging point were carried out in Bavaria in the last quarter. Each BEV also carried out an average of 9 publicly accessible charging processes, which corresponds to one charging process every one and a half weeks. In addition, each charging point accounted for the equivalent of 11 BEVs or 217 cars (regardless of the drive technology installed). The latter figure is particularly interesting if one assumes that all cars will be battery-electric in the future.
Special features in the administrative districts
While many of these administrative district figures are close to the Bavarian averages, there are also some major deviations. For example, it is noticeable that the number of charging processes per charging point in Lower Bavaria is very low at just 58. As the LV/BEV and BEV/LP indicators are also at the lowest level, it can be concluded that there are still too few BEVs on the roads in this administrative district in terms of the charging infrastructure. This is also illustrated by the below-average utilization of the public charging infrastructure compared to the other Bavarian administrative districts (see chart on the bottom right of page 3). On the contrary, the public charging infrastructure in Upper Bavaria has the highest capacity utilization in a Bavaria-wide comparison, although this is not directly apparent from the ratios due to the above-average number of AC charging points. In Upper Franconia, it is noticeable that this is not only the administrative district with the lowest number of charging points. In this district, for example, there are 320 cars per charging point. This is almost 50 percent more than the Bavarian average. However, as the proportion of fast charging points in Upper Franconia is above average, the use of public charging infrastructure is above average at 107 LV/LP. However, as the BEV/LP figure in Upper Franconia is close to the Bavarian average, it can be concluded that the proportion of BEVs in the stock is below average.
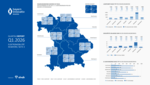
The three charts on the right show the number and distribution of charging points in the administrative districts, the amount of energy charged at these points and the average number of charging processes per charging point type (AC, DC and HPC). It should be noted here that no statement can be made about the current expansion status based purely on the number of charging points per administrative district, as this depends heavily on the size and settlement structure, but above all on the number of inhabitants and the number of vehicles. For example, the least populous administrative district, Upper Franconia, has the lowest number of charging points, while the most populous administrative district, Upper Bavaria, has by far the most charging points.
Compact overview
The quarterly report provides a compact overview of current developments in electromobility in Bavaria. The Electromobility Competence Center at Bayern Innovativ prepares the data in a factual and neutral manner.
Do you have any questions or would you like more statistics from Bavaria or your region? Then get in touch with us!
Your contact

*** Assumptions:
- The vehicle inventories are based on the KBA inventory figures at the beginning of the year and are offset against a forecast of new registrations.
- For the quotient of charging processes per charging point, we offset the total number of recorded charging processes against the number of charging points from which our service provider obtains dynamic ("live") data.
- The quarterly report documents the development of public charging infrastructure in Bavaria. The information on the development of these charging options therefore relates to publicly accessible charging locations and therefore does not generally take into account charging points from closed user groups (e.g. charging points in private underground car parks, on factory premises, etc.).